This study surveyed a nationally-representative sample of 5,005 middle and high school students between the ages of 13 and 17 in the United States. Data were collected in May and June of 2023. Click on the thumbnail images to enlarge.
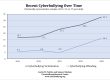
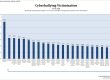
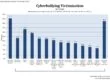
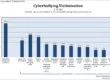
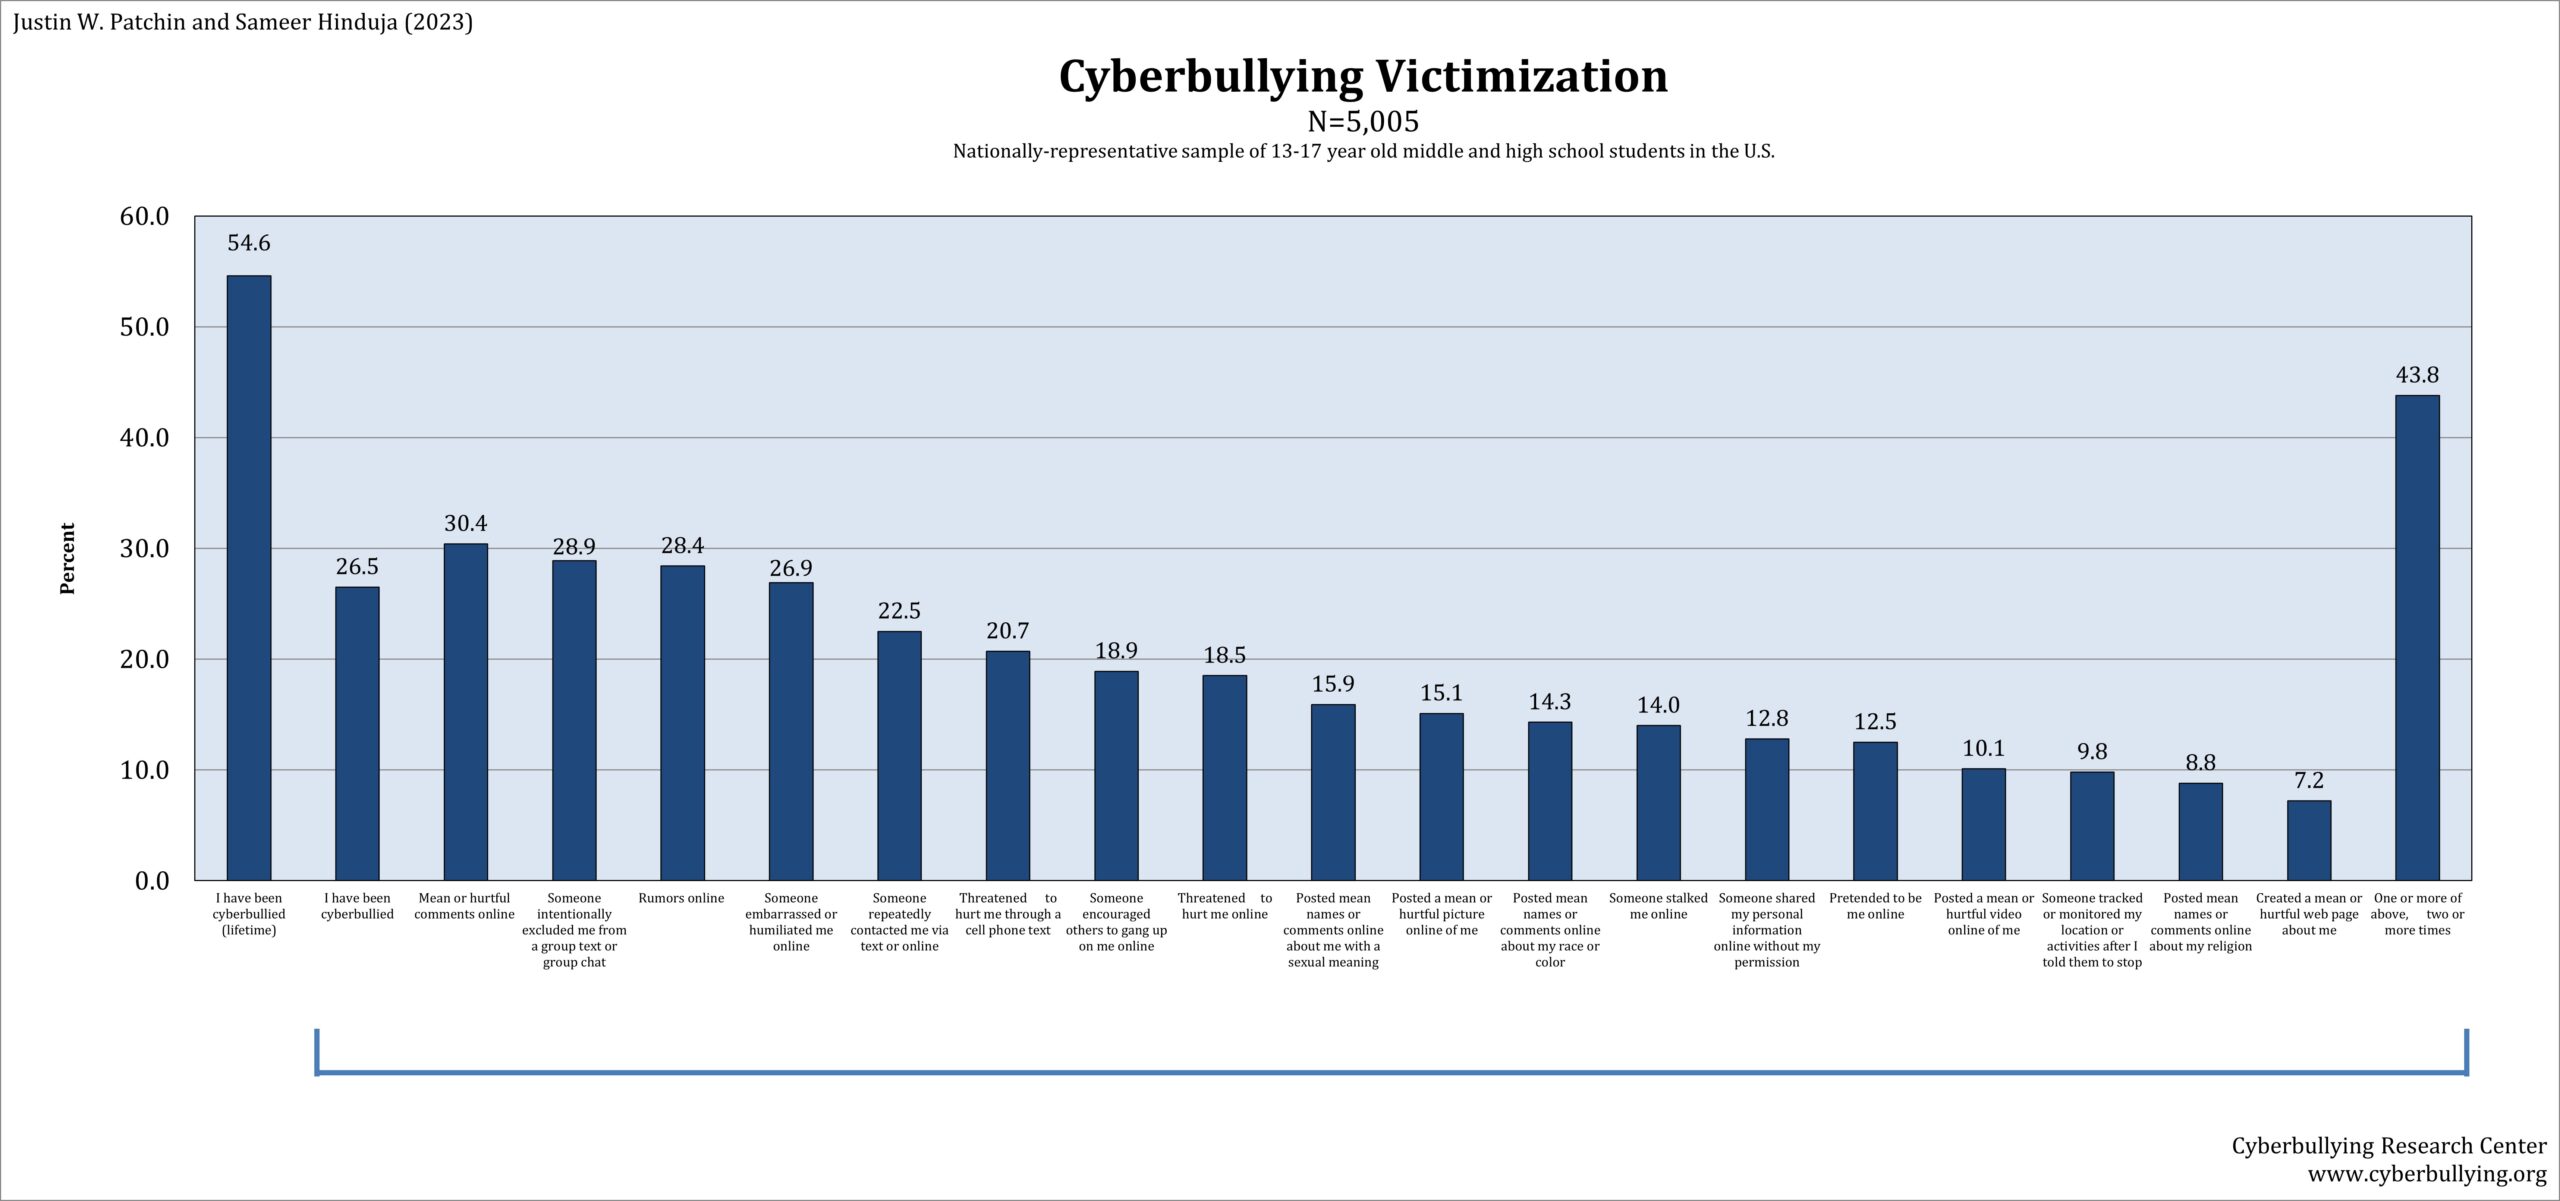
Cyberbullying Victimization. We define cyberbullying as: “Cyberbullying is when someone repeatedly and intentionally harasses, mistreats, or makes fun of another person online or while using cell phones or other electronic devices.” Approximately 55% of the students in our 2023 sample reported that they experienced cyberbullying at some point in their lifetimes. About 27% said they had been cyberbullied in the most recent 30 days. When asked about specific types of cyberbullying experienced in the previous 30 days, mean or hurtful comments posted online (30.4%), exclusion from group chats (28.9%), rumors spread online (28.4%), and someone embarrassing or humiliating them online (26.9%) were the most commonly-reported. Forty-four percent of the sample reported being cyberbullied in one or more of the eighteen specific types reported, two or more times over the course of the previous 30 days.
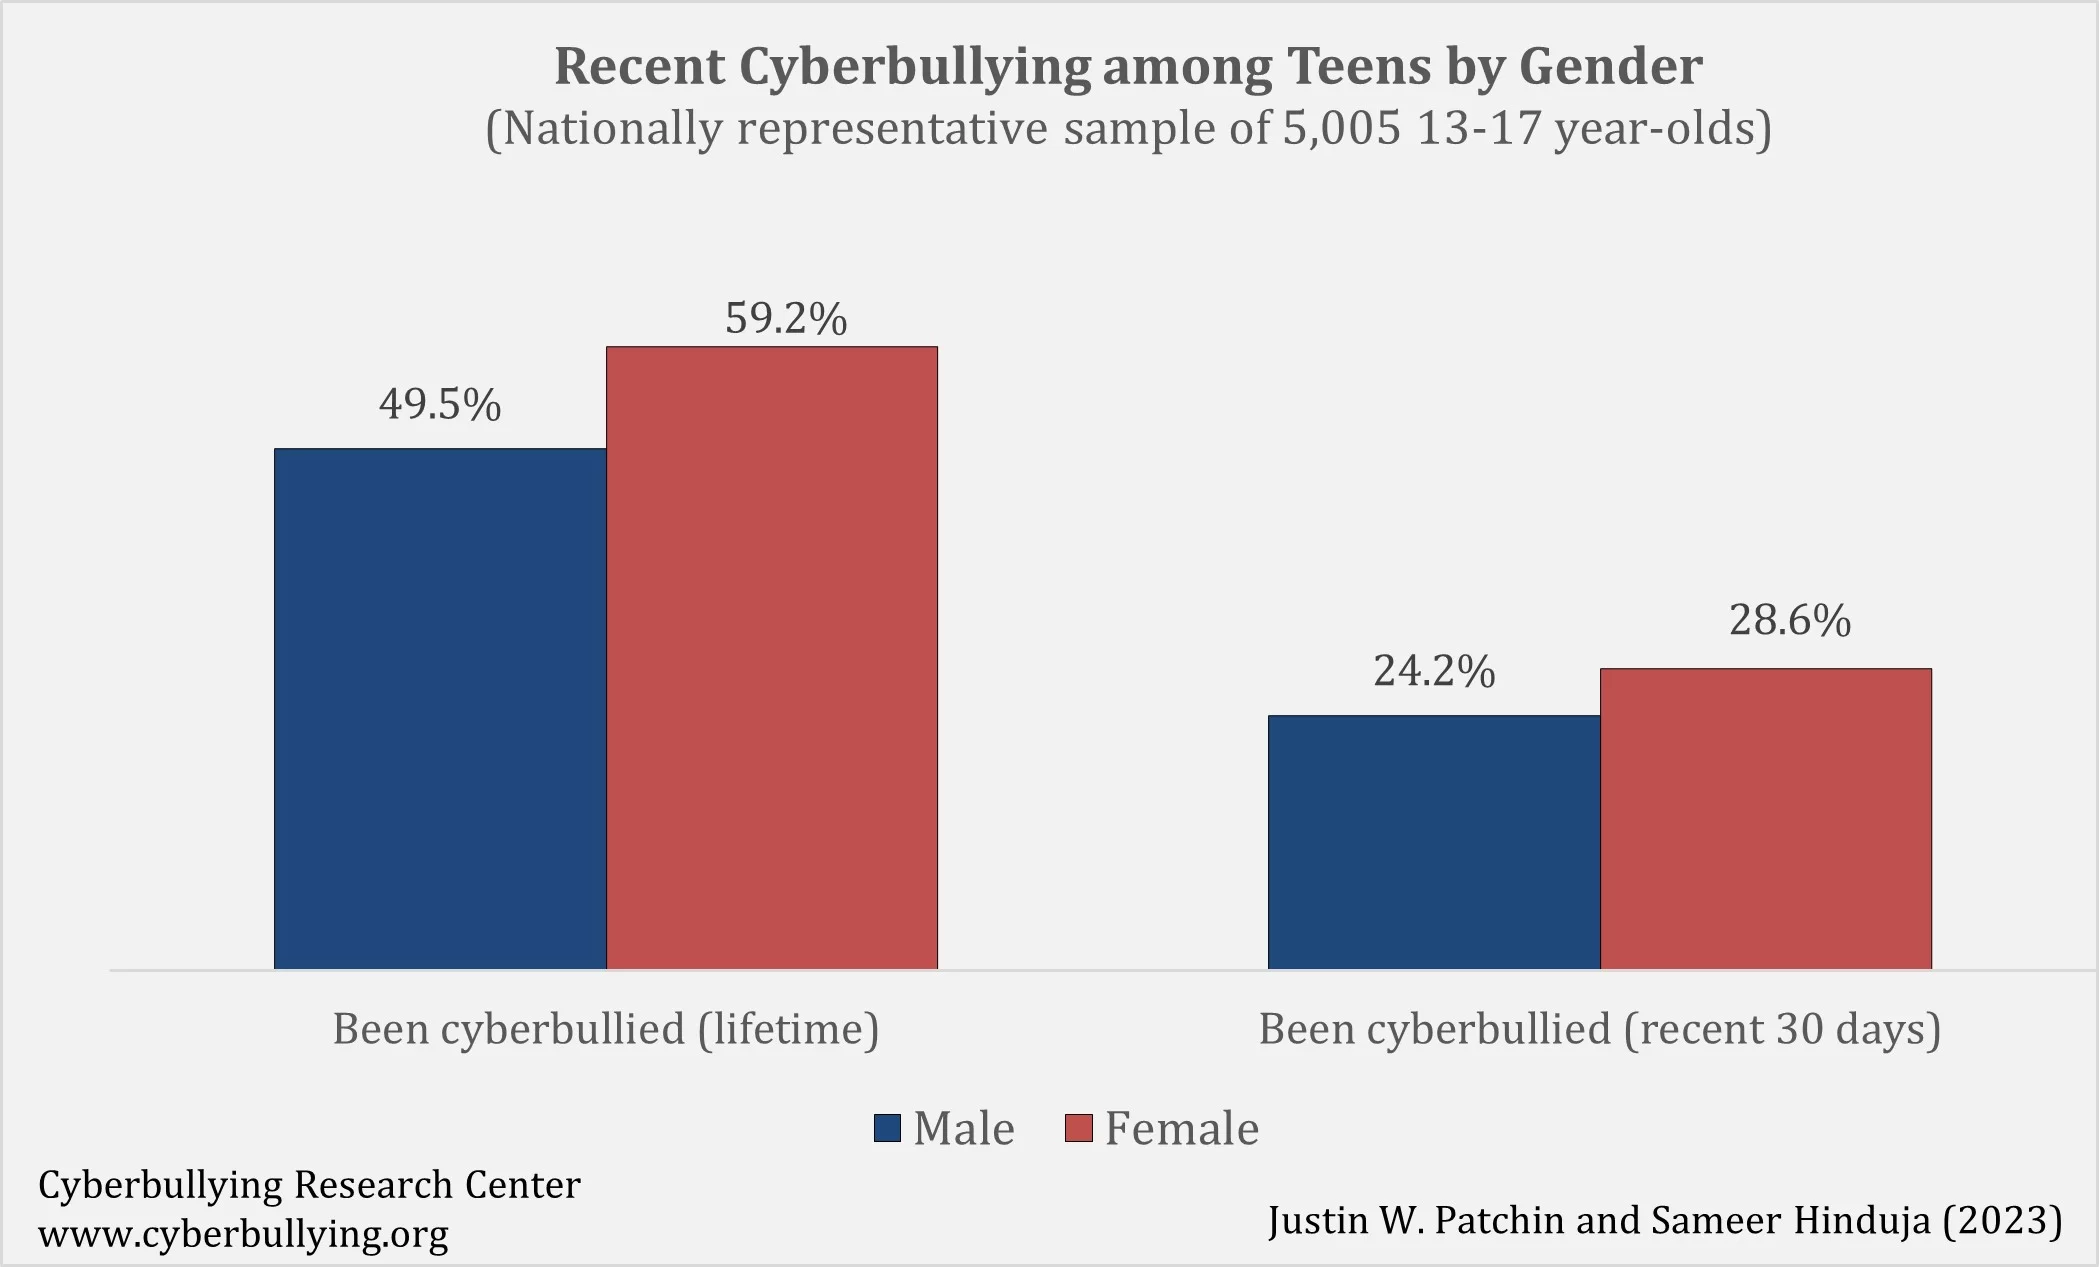
Cyberbullying by Gender. Adolescent girls are more likely to have experienced cyberbullying in their lifetimes (59.2% vs. 49.5%). This difference is not as dramatic when reviewing experiences over the previous 30 days, where rates are more similar (24.2% of boys and 28.6% of girls have been cyberbullied recently), though differences in lifetime and 30-day rates are both statistically significant (p < .001).
Methodology
For this study, we contracted with an online survey research firm to distribute our questionnaire to a nationally-representative sample of middle and high school students who were between the ages of 13 and 17. Students were asked questions about experiences with bullying and cyberbullying, digital self-harm and other experiences online and off. Overall we obtained a 15% response rate, which isn’t ideal, but is higher than most generic Internet surveys.
With any imperfect social science study, caution should be used when interpreting the results. We can be reassured somewhat in the validity in the data, however, because the prevalence rates are in line with results from our previous school-based surveys. Moreover, the large sample size helps to diminish the potential negative effects of outliers. Finally, steps were taken to ensure valid responses within the survey instrument. For example, we asked the respondents to select a specific color among a list of choices and required them to report their age at two different points in the survey, in an effort to guard against computerized responses and thoughtless clicking through the survey.
Suggested citation: Patchin, J. W. & Hinduja, S. (2024). 2023 Cyberbullying Data. Cyberbullying Research Center. https://cyberbullying.org/2023-cyberbullying-data
Select publications from this data set:
Coming soon…
Blog posts based on this data set:
October 4, 2023 – Cyberbullying Continues to Rise among Youth in the United States