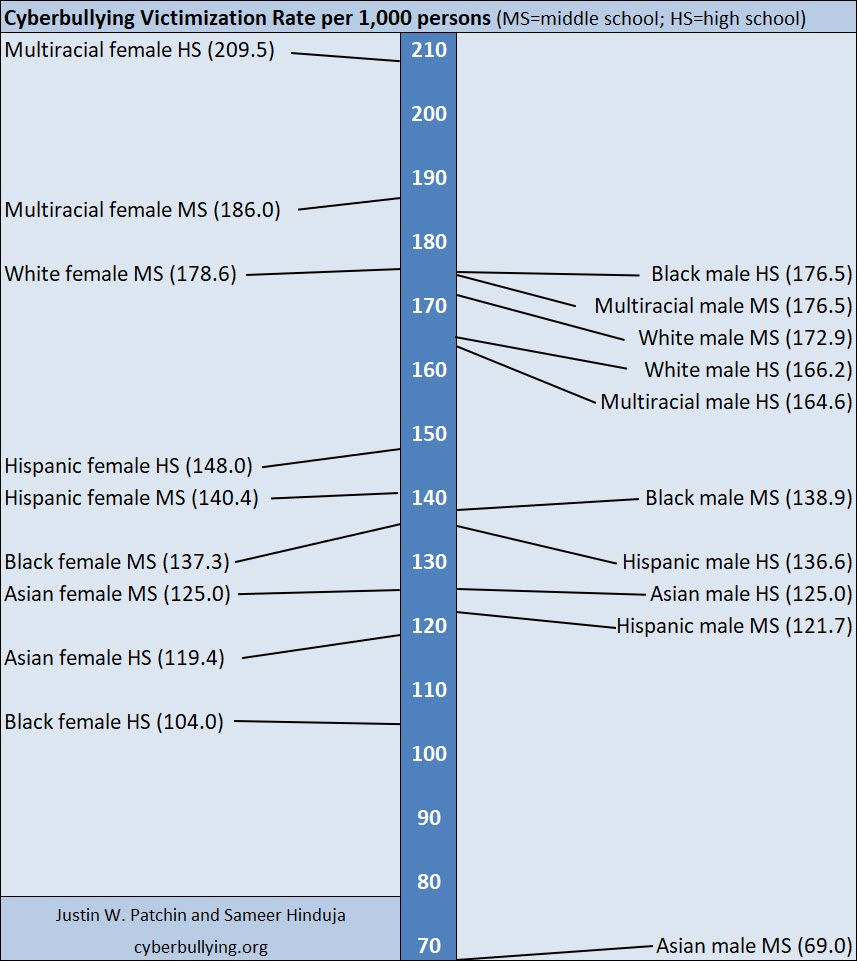
Our 2016 survey involved a large enough sample of American middle and high school students that it allows us to extrapolate rates of victimization for various demographic subgroups. For this particular chart, we examined cyberbullying victimization within the last 30 days for three characteristics: race, sex, and age. Even with a sample of more than 5,500 respondents from around the United States, some of these subcategories got a bit small (subsample sizes ranged from 29 to 1,191), so we should take care not to over-generalize the results. With that caveat in mind, it is interesting to see that multiracial females, both in high school (209.5 out of 1,000) and middle school (186 out of 1,000) are most at risk for experiencing cyberbullying compared to other demographic subgroups. While females occupied the top three spots for victimization risk, males weren’t far behind with the next five spots. Asian and Hispanic students were near the bottom for risk. There doesn’t appear to be a clear pattern with respect to age, which surprised me a bit since usually we find that middle school students are involved in cyberbullying more often. It total, we looked at nineteen different subcategories (for which we had a suitable subsample size).
When I set out to create this chart, I did so because I was simply interested in how race, sex, and age were related to cyberbullying victimization. After reviewing the results, a few thoughts occurred to me. While almost all of our research papers include controls for race, we (like others) are usually forced to dichotomize race as white or nonwhite. We are therefore only examining whether white students are different from nonwhite students. As a result, we generally do not see significant relationships by race. That is, our research would suggest that there are no differences based on race when it comes to experiencing cyberbullying. In looking at the different subgroups in this chart, we can see why: white students are generally in the middle, while nonwhite students occupy the upper and lower ends of the continuum of risk. When the nonwhite students are averaged, their experiences end up looking a lot like those of white students. Indeed white students overall had victimization rates only sightly higher (175.3) than nonwhites (144.7), but this relatively small discrepancy belies the true differences among those who fall in the nonwhite category: multiracial females and black and multiracial males have significantly higher victimization rates, while Asian and Hispanic students have lower victimization rates compared to their white counterparts. The takeaway message for me is that more cyberbullying research needs to focus on under-represented racial groups. That requires collecting larger samples from the general public to ensure large enough numbers of minority groups, or to purposely oversample these groups (or even focus exclusively on them).
It is also true that there is disagreement in the academic literature regarding whether boys or girls are more likely to experience cyberbullying. We’ve even seen differences in our own research over time. Much of the difference across studies can be attributed to the different ways that cyberbullying is measured. For example, if a survey asks about rumor spreading or hurtful commenting behaviors, then girls are more likely to be involved. Whereas if a survey includes questions about mistreatment in videos or via online gaming platforms, boys are more frequently involved. The broader the measure of online victimization, the fewer discrepancies are generally seen. We discuss these issues in depth in our book Bullying Beyond the Schoolyard, but I think can do a better job of acknowledging the varying experiences of different groups, and of examining them more thoughtfully in our research.
Suggested citation: Patchin, J. W. (2019). Cyberbullying Victimization Rates by Race, Sex, and Age. Cyberbullying Research Center. https://cyberbullying.org/cyberbullying-victimization-rates-2016